30
AT84AD001B
2153C–BDC–04/04
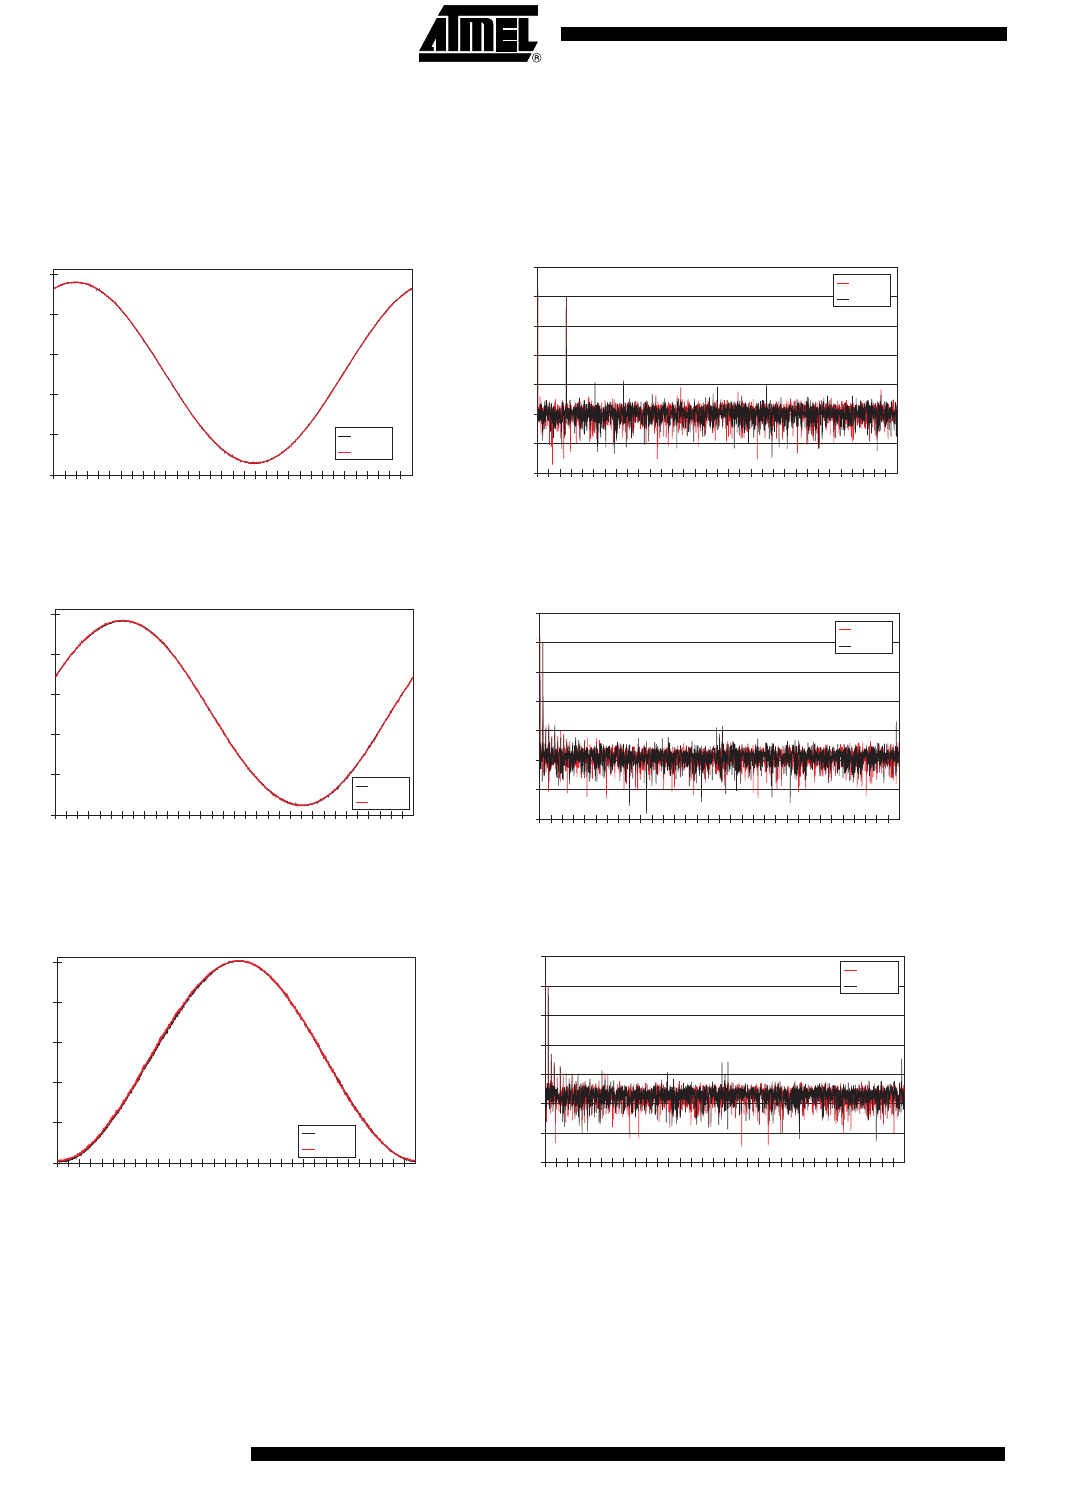
Typical Reconstructed
Signals and Signal
Spectrum
Figure 31. Fs = 1 Gsps and Fin = 20 MHz (1:2 DMUX, Fs/2 DR Type, FiSDA = -15 ps, ISA = -50 ps)
Figure 32. Fs = 1 Gsps and Fin = 500 MHz (1:2 DMUX, Fs/2 DR Type, FiSDA = -15 ps, ISA = -50 ps)
Figure 33. Fs = 1 Gsps and Fin = 1 GHz (1:2 DMUX, Fs/2 DR Type, FiSDA = -15 ps, ISA = -50 ps)
Note: The spectra are given with respect to the output clock frequency observed by the acquisition system (Figures 31 to 33).
0
50
100
150
200
250
1 513 1025 1537 2049 2561 3073 3585
Samples
Codes
Ch IA
Ch QA
-120
-100
-80
-60
-40
-20
0
20
0 31 62 93 125 156 187 218 249
F (Msps)
dBc
Ch IA
Ch QA
0
50
100
150
200
250
1 513 1025 1537 2049 2561 3073 3585
Samples
Codes
Ch IA
Ch QA
-120
-100
-80
-60
-40
-20
0
20
0 31 62 93 125 156 187 218 249
F (Msps)
dBc
Ch IA
Ch QA
0
50
100
150
200
250
1 513 1025 1537 2049 2561 3073 3585
Samples
Codes
Ch IA
Ch QA
-120
-100
-80
-60
-40
-20
0
20
0 31 62 93 125 156 187 218 249
F (Msps)
dBc
Ch IA
Ch QA
Fout/2


