REV. 0
–9–
AD8353
OUTPUT 1 dB COMPRESSION POINT – dBm
7.0 7.2
PERCENTAGE – %
10
45
35
0
40
30
20
5
7.4 7.8 8.2 8.4 8.68.0 8.87.6
15
25
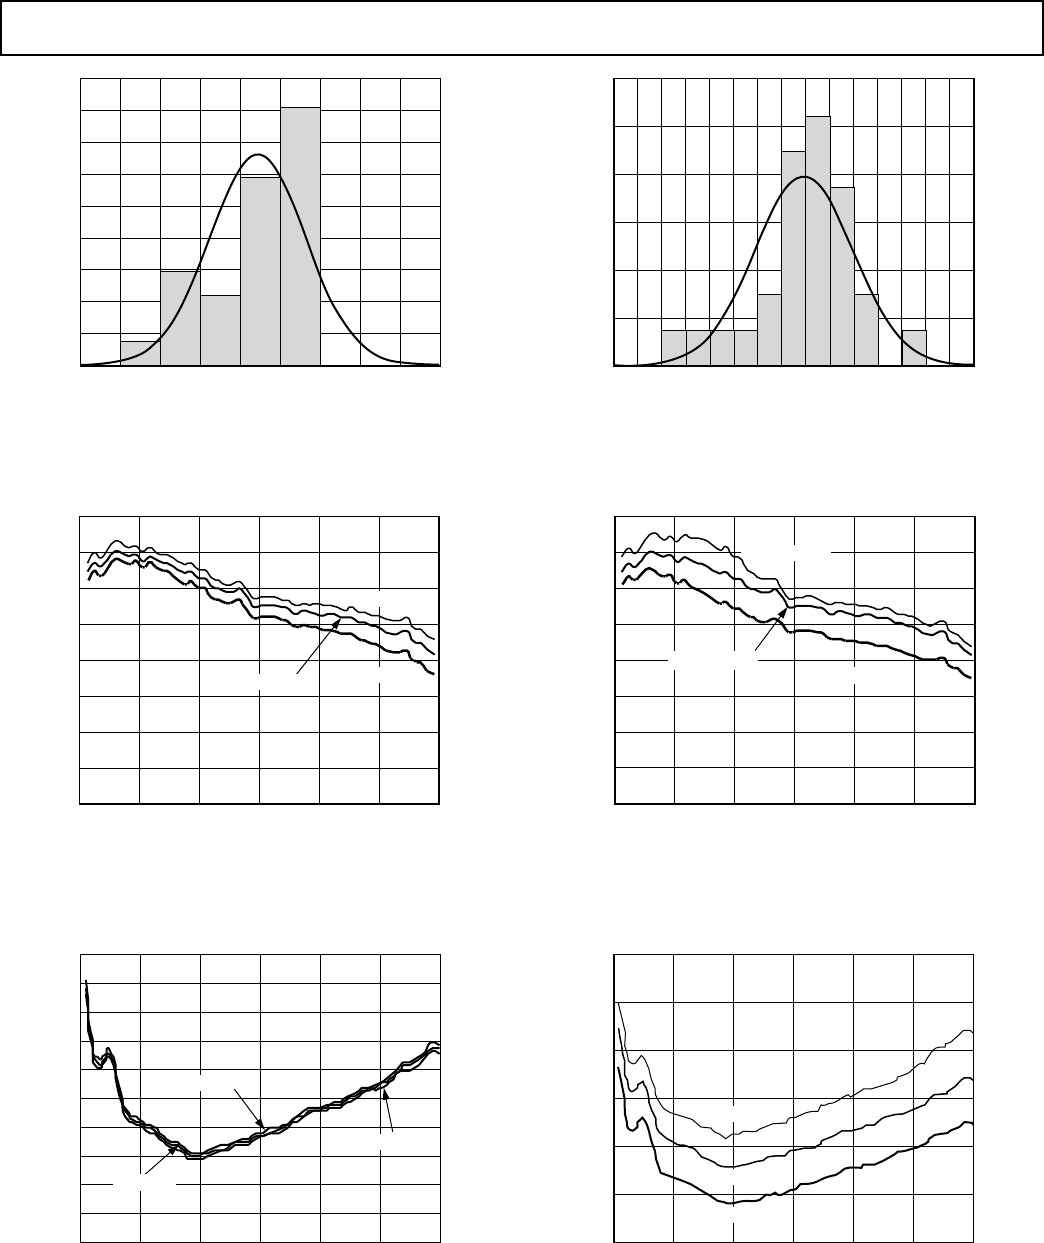
TPC 25. Distribution of P
1 dB
, V
S
= 3 V, T
A
= 25
°
C,
f = 2.2 GHz
FREQUENCY – MHz
500
1000 1500 2000 2500
OIP3 – dBm
20
16
12
3000
26
24
10
18
14
22
OIP3 AT 5.5V
OIP3 AT 5.0V
OIP3 AT 4.5V
0
TPC 26.
OIP3 vs. Frequency, V
S
= 4.5 V,
5 V, and
5.5 V, T
A
= 27
ⴗ
C
FREQUENCY – MHz
500 1000 1500 2000 2500
NOISE FIGURE – dB
6.5
5.5
4.5
3000
9.0
8.0
4.0
6.0
5.0
7.0
8.5
7.5
NF AT 4.5V
NF AT 5.5V
NF AT 5.0V
0
TPC 27.
Noise Figure vs. Frequency, V
S
= 4.5 V, 5 V,
and 5.5 V, T
A
= 25
ⴗ
C
OIP3 – dBm
18.8 20.0
PERCENTAGE – %
10
30
0
20
5
20.4 21.2 21.620.8
25
15
19.619.2
TPC 28. Distribution of OIP3, V
S
= 5 V,
T
A
= 25
ⴗ
C,
f = 2.2 GHz
FREQUENCY – MHz
500 1000 1500 2000 2500
OIP3 – dBm
20
16
12
3000
26
24
10
18
14
22
OIP3 AT –40
ⴗ
C
OIP3 AT +25
ⴗ
C
OIP3 AT +85
ⴗ
C
0
TPC 29.
OIP3 vs. Frequency, V
S
= 5 V,
T
A
= –40
ⴗ
C,
+25
ⴗ
C, and +85
ⴗ
C
FREQUENCY – MHz
500 1000 1500 2000 2500
NOISE FIGURE – dB
7
5
3000
10
9
4
8
6
NF AT –40
ⴗ
C
NF AT +85
ⴗ
C
NF AT +25
ⴗ
C
0
TPC 30. Noise Figure vs. Frequency, V
S
= 5 V, T
A
= –40
ⴗ
C,
+25
ⴗ
C, and +85
ⴗ
C


